![[icon] Healthcare IT](https://asset.fujifilm.com/www/mm/files/2024-08/e6b235a19a434f445c8253811a31f019/healthcare-it.svg)
![[icon] X-ray](https://asset.fujifilm.com/www/mm/files/2024-08/30e9156ebcd542c0ea4573f563b073bd/x-ray.svg)
![[icon] Ultrasound](https://asset.fujifilm.com/www/mm/files/2024-08/af70b9d899be94291dc8fec63305f2cb/ultrasound.svg)
![[icon] Endoscopy](https://asset.fujifilm.com/www/mm/files/2024-08/6cf57ad8a7d189112d947ab1521c7bae/endoscopy.svg)
![[icon] In Vitro Diagnostics](https://asset.fujifilm.com/www/mm/files/2024-08/361f8bad821eed2c86224094fe4762e3/ivd.svg)
![[icon] Veterinary Medicine](https://asset.fujifilm.com/www/mm/files/2024-08/742cb980540d8c5e34e87e40ad3fdaf0/veterinary.svg)
![[icon] MRI and CT](https://asset.fujifilm.com/www/mm/files/2024-08/e49b65b8326e0c54991f7a8e6c3161eb/mri-and-ct.svg)
![[icon] Office Solutions](https://asset.fujifilm.com/www/mm/files/2024-08/ef127917cf517b562071ac86a121c7b8/office.svg)
![[icon] Graphic Arts & Printing](https://asset.fujifilm.com/www/mm/files/2024-08/583c9ea74e42db7020ba65ae6bde1a44/graphic.svg)
![[icon] Photofinishing Products](https://asset.fujifilm.com/www/mm/files/2024-08/eef46655042931d0ec5d0173c7cd8597/photofinishing.svg)
![[icon] Optical Devices](https://asset.fujifilm.com/www/mm/files/2024-08/eeddc226392be0bfb1c024e0b22140ce/optical-devices.svg)
![[icon] Cine & Broadcast Products](https://asset.fujifilm.com/www/mm/files/2024-08/b641bb60056608a745b5bba3a669f65c/film-and-broadcast.svg)
![[icon] Security Protections](https://asset.fujifilm.com/www/mm/files/2024-08/9d056c5b0fdb23ef156bbe4fa1f55464/security.svg)
![[icon] Manufacturing Process](https://asset.fujifilm.com/www/mm/files/2024-08/078b827214c172a0935f7ee95ee36da6/manufacturing-process.svg)
![[icon] Inspectional Products](https://asset.fujifilm.com/www/mm/files/2024-08/4768ed8144646543d7784a772e91c0c5/inspection.svg)
![[icon] Data Management](https://asset.fujifilm.com/www/mm/files/2024-08/ffe71ea8ce018cfaa1d2eb2037a3e300/data-management.svg)
![[icon] Materials](https://asset.fujifilm.com/www/mm/files/2024-08/54ea915ccc3705c6900ea018f6ae6d9b/materials.svg)


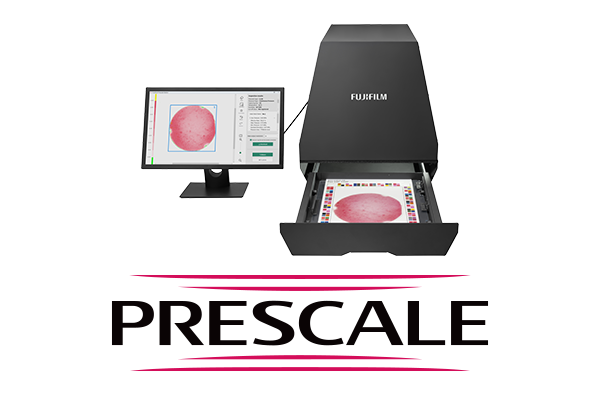
FPD-8010E provides a wide range of effective presentation and report functions utilizing FPD-8010E software and a scanner to digitize Prescale outputs to allow the user to produce multi-faceted measurement data such as pressure distribution and enlargement, cross-sectional distribution, and 3-D image display.
This serves to accelerate product development and improved yields based on detailed multi-faceted measurement data and analysis.
Dedicated Software
Converts Prescale density values into pressure values.
Dedicated Cover
This manuscript hold-down scanner cover improves date-read precision.
Calibration Sheet
The calibration sheet limits scanner-read errors to a fixed range.
Various data such as average pressure and maximum pressure are displayed.*1
The specified field is enlarged. (X 4, X 8, X 16)
Pressure distribution on a line passing through a specified point is shown on a line graph.
Pressure is displayed in 3-D format.*2
The upper and left segments of the total pressure are displayed on a bar graph.
Pressure on the circumference is displayed as a histogram.*2
Pressure data is exported to a text file.*2
Step-by-step pressure values are displayed in animated format.
- *1 The scope of for Ultra Extreme Low Pressure(5LW) that can be measured by pressure image analysis system FPD-8010E is 0.015MPa to 0.050MPa.
- *2 Ultra Extreme Low Pressure(5LW) is not supported.

1)Prepare the colored Prescale.

2)Scan Prescale Samples (Scanner purchased separately by user)

3)Perform analysis utilizing FPD-8010E Software.