Structure
One side of the base film has a UV light sensitive layer and the opposite side has a white layer. The light sensitive layer changes color according to the amount of UV light it receives, so the amount of light distributed on the exposed surface can be easily seen by observing the light sensitive layer and white layer when they are attached to the base.
Principle
The color-forming material in the microcapsules reacts with the UV light and changes color.
Standard color chart
The figure on the right represents color characteristics generated by a high-pressure mercury lamp. However, please note that these color characteristics are values generated by using Fujifilm light sources and devices, so there may be differences in color density for a given amount of light due to differences and variations in individual lamps or the environment.
Advantages of visual checks
Referring to standard color charts makes it possible to visually judge accumulated light values in an easy way.
Providing color samples can significantly reduce the time necessary for checking the amount of UV light when starting work and switching objects to be exposed.
- * Each density is the value measured by Fujifilm. It is not a guarantee of density level.
-
* The amounts of UV light are values using a 365 nm UV illuminometer.
-
* The solid lines on the graph show the recommended measurement range. The broken lines represent values that are not as precise as the solid lines and should be used as reference only.
-
* Standard Color Samples show the density range for visual evaluation.
After cutting UVSCALE to the required shape (length), place it on the location that you want to measure.
Operate the equipment or device, and expose UVSCALE to UV light.
- * The side of the UVSCALE with the matte surface should be exposed.
UVSCALE changes color in accordance with the amount of UV light.
Remove the UVSCALE, and determine the distribution of UV light by observing the color distribution.
- * Use the matte side for observing.
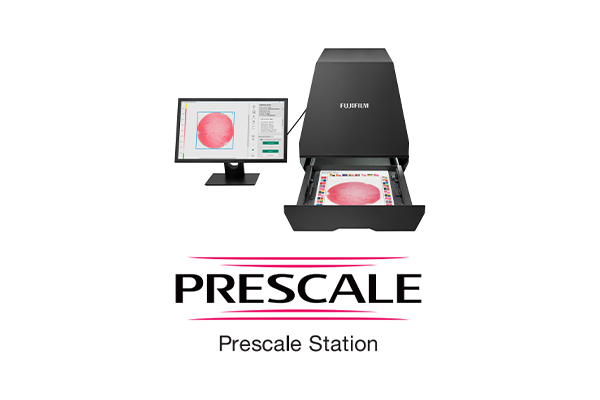
Set UVSCALE on the special scanner and scan the color sample.
Analyze it on a PC with the exclusive software installed.
- * Entering a correction value can correct differences in light amount values caused by differences in illuminometers, temperature, and other measurement conditions to obtain an appropriate value. Furthermore, the obtained data can be converted into numerical values, and the measurement data of the entire area or specified parts can be displayed in rectangular or circular form.